What’s the Difference Between 1-Year and 5-Year American Community Survey (ACS) Data?
The ACS provides demographic data in several “packages”: 1-year estimates, 1-year supplemental estimates, and 5-year estimates. These data represent a sample of housing unit addresses contacted every year by the U.S. Census Bureau.
The American Community Survey (ACS) is an ongoing survey that provides data every year about the social, economic, housing, and demographic characteristics of America’s communities. Results give Illinois communities the current information they need to plan investments and services, such as those that support young children and their families. This is one of several reasons why demographic data from the ACS are an important part of IECAM’s early childhood data collection.
The infographic below summarizes some of the important differences between 1-year (including 1-year supplemental estimates for areas with populations of 20,000 and more) and 5-year estimates.
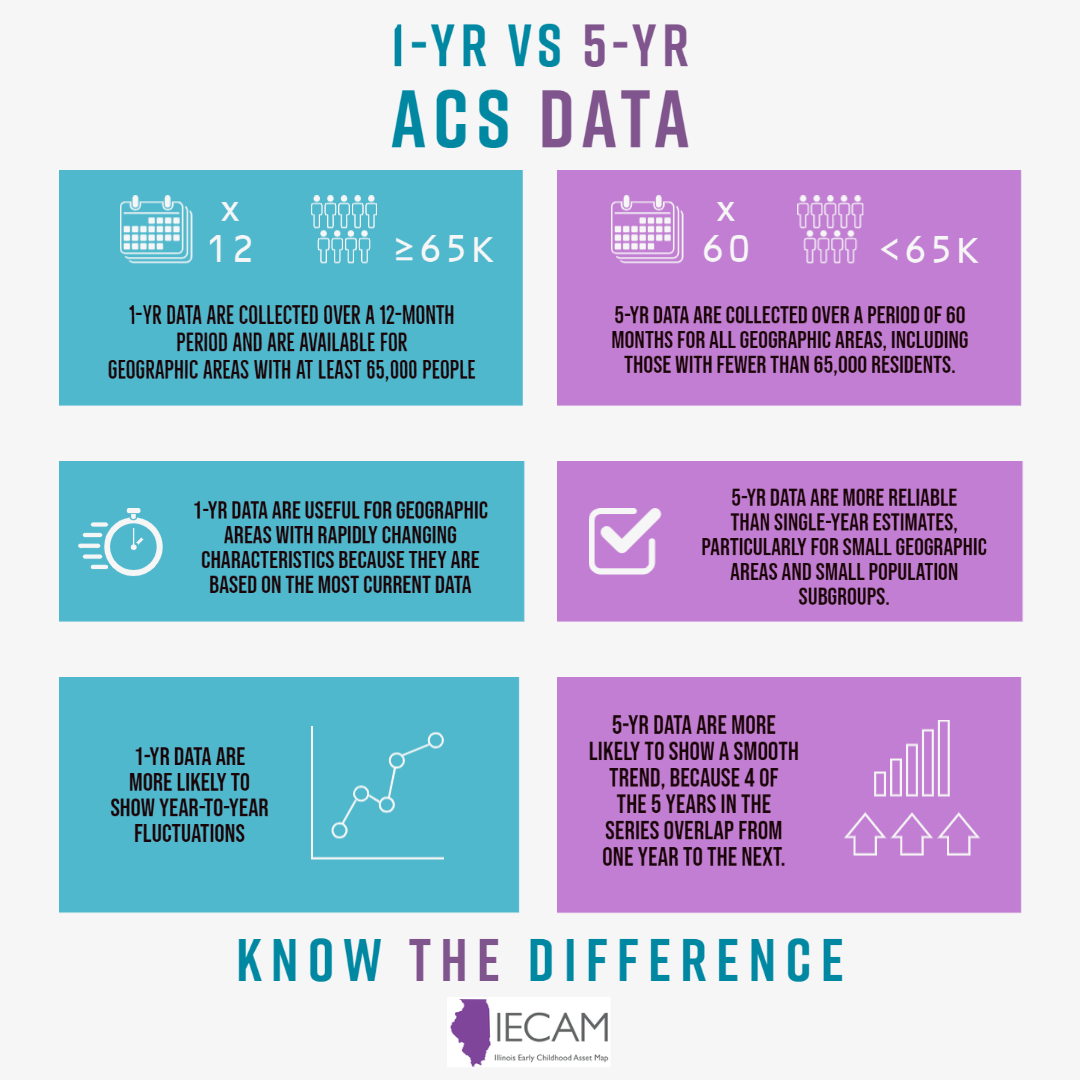
At times, IECAM gets questions about which estimates we provide. For the most part, IECAM uses ACS 5-year estimates because they are the most reliable and have the largest sample size. Also, because of the sample-size requirements, ACS 1-year estimates for many characteristics are only available for fewer than one-fourth of our state’s 102 counties.
Capturing Trends Using 1-Year and 5-Year Data
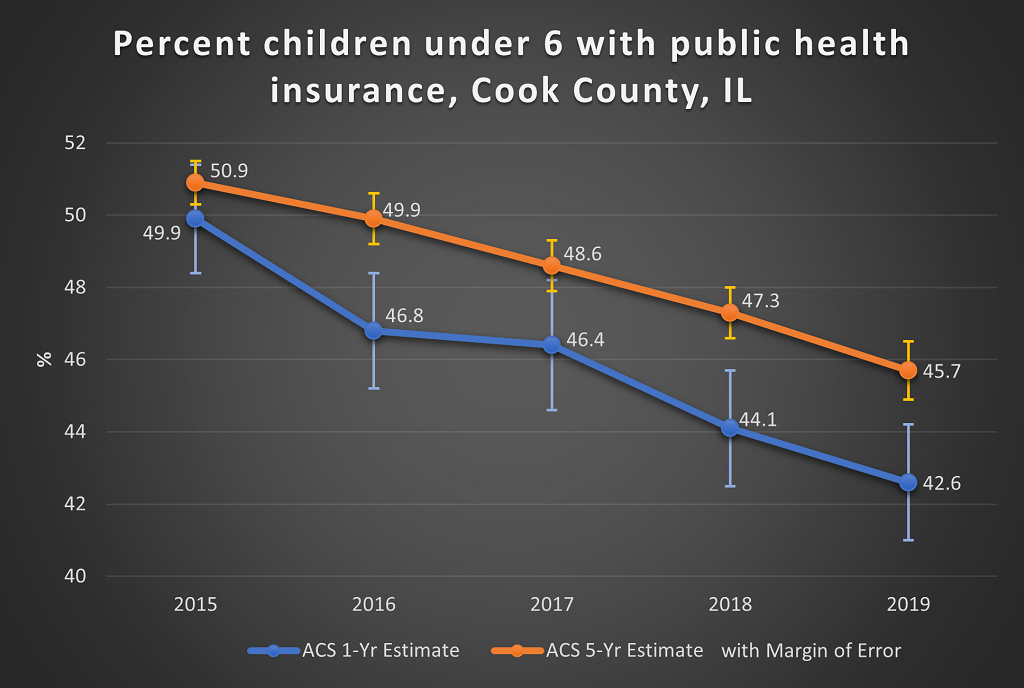
The differences between 1-year and 5-year estimates are especially important to note when using data to communicate stories or visualize trends. First, for areas with both estimates available, it is important to be consistent in using the same estimate (1-year or 5-year, not a mix). Second, as the chart below shows, actual estimates can vary quite a bit between 1-year and 5-year estimates. In these situations, it is important to consider your overall communication goal. Is it to communicate the variabilities between points of time (sudden changes that can occur due to economic, social, or health events) or a general trend? If it is to communicate sudden changes, then 1-year estimates might be best because they are based on the most current data. General trends, however, might be best communicated using more reliable 5-year estimates.
Margins of Error
Margins of error allow data users to measure the range of uncertainty around a given estimate. The ACS sets this range at a standard of a 90% confidence level. In other words, looking at 5-year estimates (in orange) on the chart below, we can be 90% confident that the true percent of children under 6 with public health insurance in Cook County in 2019 lies within the range indicated (44.9–46.5%).
In addition, note that the margin of error is narrower for the 5-year data trend line (in orange), meaning one could have more confidence that the 5-year estimates reflect the result of a survey of the entire population. In general, the larger the sample size, the smaller the margin of error.
Why do margins of error matter? The margin of error can allow you to see if there’s enough evidence to conclude the estimates are statistically different from one another. In short, adding it to a chart can communicate the accuracy of the data.
More Resources
-
American Community Survey (ACS)
An ongoing survey that provides data every year about the social, economic, housing, and demographic characteristics of America’s communities
-
Handbooks for Data Users
American Community Survey (ACS) data from the U.S. Census Bureau
-
Understanding and Using American Community Survey Data: What All Data Users Need to Know
Handbooks for Data Users from the U.S. Census Bureau
-
When to Use 1-year or 5-year Estimates
U.S. Census Bureau Guidance for Data Users
-
American Community Survey Data Users Group
Joining this group allows you to ask other data users questions and browse past answers.