Poverty-Related Data and Resources on IECAM
Research has consistently shown that poverty has a significant and lasting impact on a child’s development. Below find a list of data and resources related to early childhood and poverty.
IECAM Resources
-
Online database
To get the most recent poverty data available in spreadsheets choose "Federal Poverty Levels" under the "Demographics" tab and then select a geographic area and year. You can also do a multiyear search that lets you compare tabular data for a single data type over multiple years. Great for identifying trends and changes over time. To get poverty data over time in spreadsheets choose "Population, by income-to-poverty ratios and age (0-5)" under the "Early Childhood Service Types & Demographics" tab for a selected range of years.
-
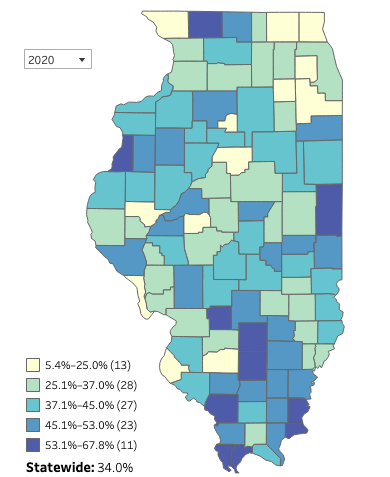 Poverty Levels: Children Age 5 and Under by Federal Poverty Level
Interactive map and downloadable data in spreadsheets and maps for children age 5 and under by federal poverty level (50%, 100%, 130%, 185%, 200%, and 400%) and geographic area for single years.
-
Children in Working Families
Search our online database for data on family employment conditions for children age 5 and under. Choose "Children in Working Familes" under the "Demographics" tab and then select a geographic area and year.
-
Employment
Unemployment rate in spreadsheets, charts, and maps for annual average unemployment rates and numbers in labor force, by state and county.
-
Social and Economic Conditions: Establishing Community Context for Early Childhood Decision Making
Resources for understanding local economic and social conditions.
-
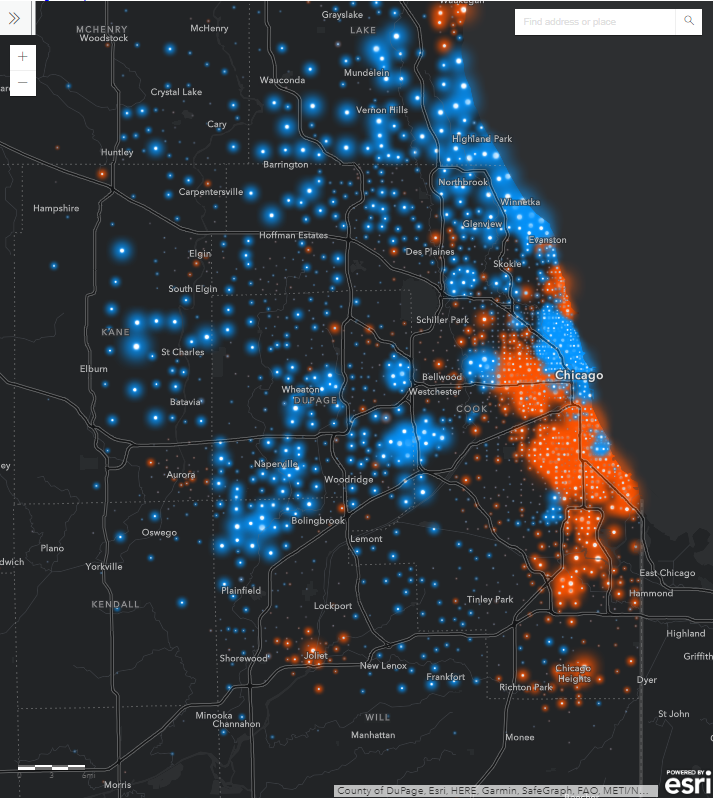 Income Map: Where are the Highest and Lowest Incomes in Illinois?
This map can help advocates, policy makers, and others find areas of high and low incomes by census tract across Illinois.
Information About Poverty Levels and Data
-
U.S. Census Bureau: Income and Poverty
Income is the gauge many use to determine the well-being of the U.S. population. Survey and census questions cover poverty, income, and wealth.
Additional Resources
-
U.S. Census Bureau: Small Area Income and Poverty Estimates: 2021
View and download 2021 state and county estimates for Small Area Income and Poverty estimates.
-
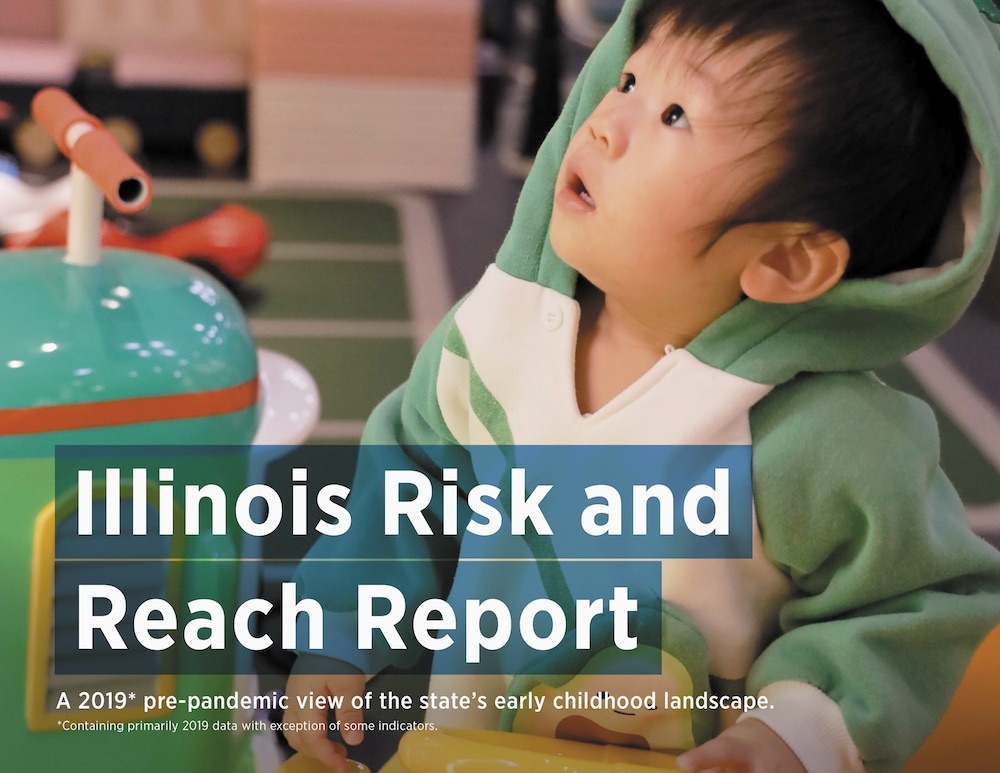 Illinois Risk and Reach Report
Data tools in three early childhood focused domains: Family Stability (including poverty indicators), Health, and Early Care and Education.
-
Heartland Alliance’s 2020 Poverty Report and data dashboard
Heartland Alliance’s report on Illinois poverty for 2020.
-
The Basic Facts About Children in Poverty
Report from Center for American Progress, 2021
-
Data Quality Campaign: Accurate Student Poverty Data is Crucial to Supporting All Students: Fast Facts for Policymakers and System Leaders
Policy brief about student poverty measures.